Plot the response variable against the predictor variables.
Source:R/plot_functions.r
response_plot.RdPlot the response variable against the predictor variables.
response_plot(
  data.,
  formula.,
  geoms = NULL,
  global_aes = NULL,
  plot = TRUE,
  nrow = NULL,
  ncol = NULL
)
Arguments
- data.
A data frame containing the variables in the formula.
- formula.
A formula of the form y ~ x1 + x2 + ... + xn, where y is the response variable and x1, x2, ..., xn are the predictor variables. A dot as right hand side is allowed.
- geoms
A list of ggplot2 geoms to be added to the plot.
- global_aes
A list of global aesthetics to be added to the plot.
- plot
A logical value indicating whether the plot should be displayed.
- nrow, ncol
Number of rows / columns in plot.
Value
A list of ggplot2 plots.
Examples
library(ggplot2)
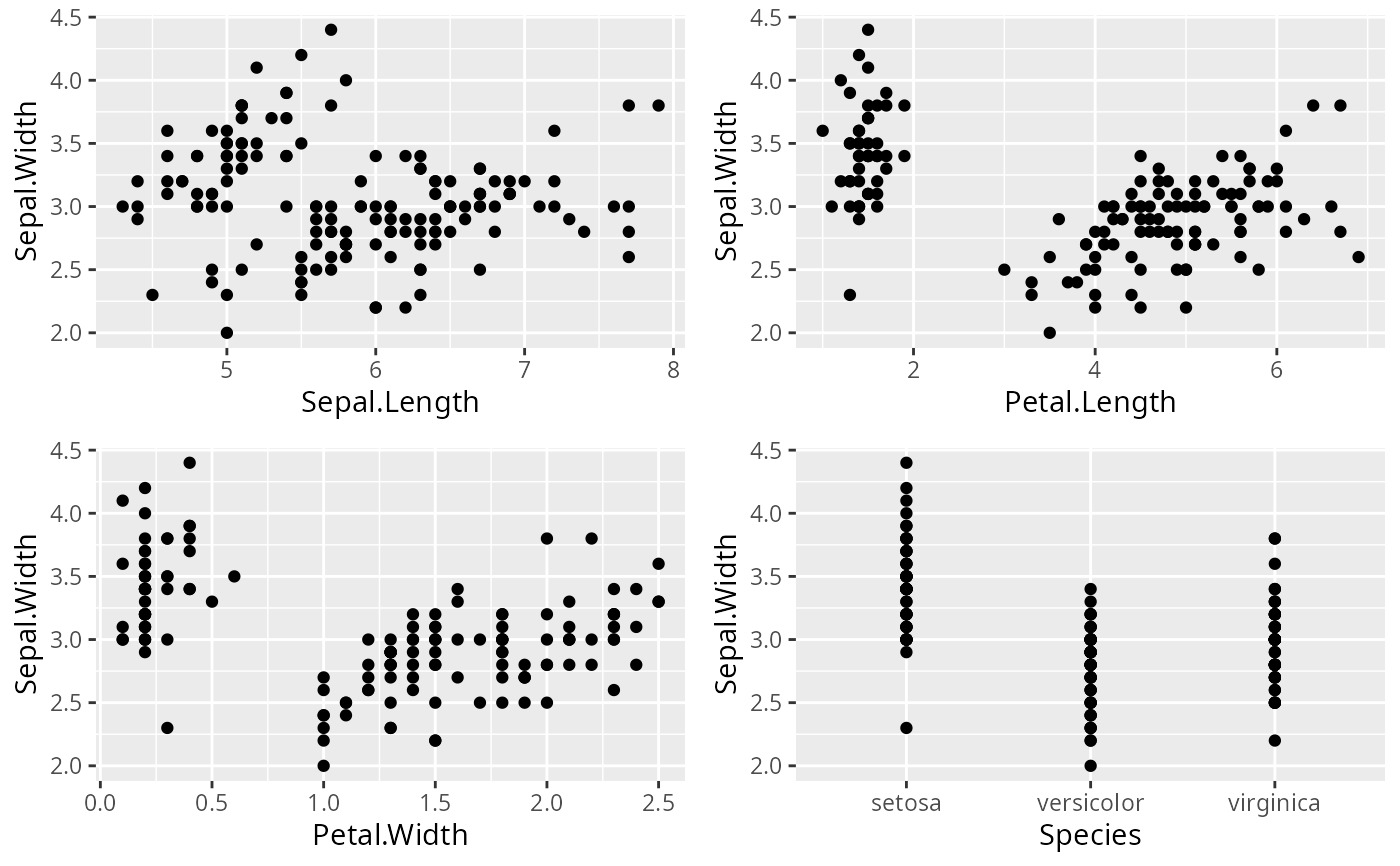
response_plot(iris, Sepal.Width ~ ., geoms=geom_point())
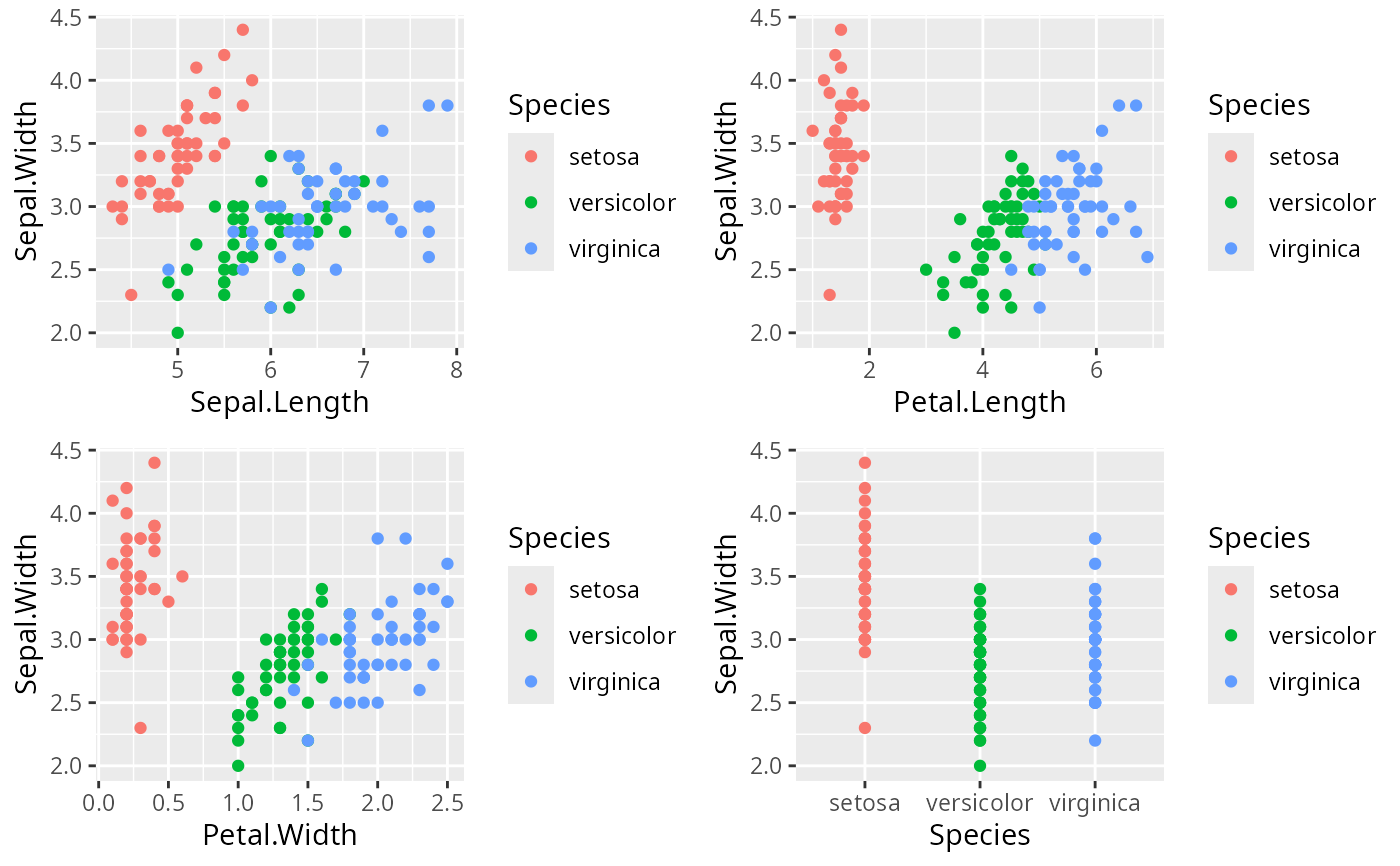
 response_plot(iris, Sepal.Width ~ ., geoms=geom_point(), global_aes=list(color="Species"))
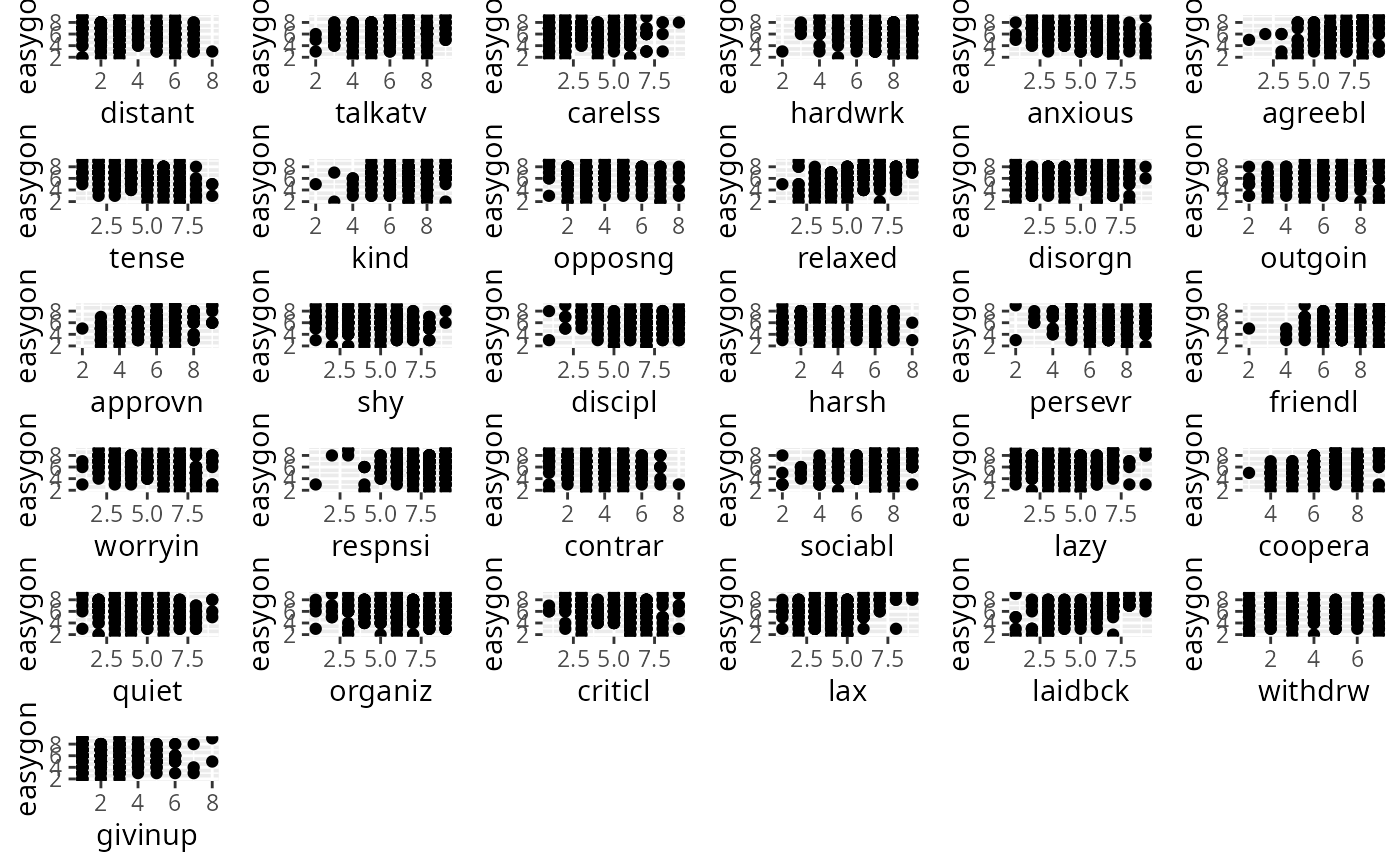
 personality |> response_plot(easygon~., geoms=geom_point(), global_aes=NULL)