Recover data from principal component analysis based on the first (typically few) components.
recover_pca_data(object, comp = 1)Arguments
Value
A dataframe
Examples
crime <- doBy::crimeRate
rownames(crime) <- crime$state
crime$state <- NULL

o <- order(apply(scale(crime), 1, sum))
dat <- crime[o,]
head(dat)
#>              murder rape assault robbery burglary larceny autotheft
#> NorthDakota     0.9  9.0    43.8    13.3    446.1  1843.0     144.7
#> SouthDakota     2.0 13.5   155.7    17.9    570.5  1704.4     147.5
#> WestVirginia    6.0 13.2    90.9    42.2    597.4  1341.7     163.3
#> Iowa            2.3 10.6    89.8    41.2    812.5  2685.1     219.9
#> Wisconsin       2.8 12.9    63.7    52.2    846.9  2614.2     220.7
#> NewHampshire    3.2 10.7    76.0    23.2   1041.7  2343.9     293.4
tail(dat)
#>            murder rape assault robbery burglary larceny autotheft
#> Alaska       10.8 51.6   284.0    96.8   1331.7  3369.8     753.3
#> Arizona       9.5 34.2   312.3   138.2   2346.1  4467.4     439.5
#> Florida      10.2 39.6   449.1   187.9   1859.9  3840.5     351.4
#> NewYork      10.7 29.4   319.1   472.6   1728.0  2782.0     745.8
#> California   11.5 49.4   358.0   287.0   2139.4  3499.8     663.5
#> Nevada       15.8 49.1   355.0   323.1   2453.1  4212.6     559.2
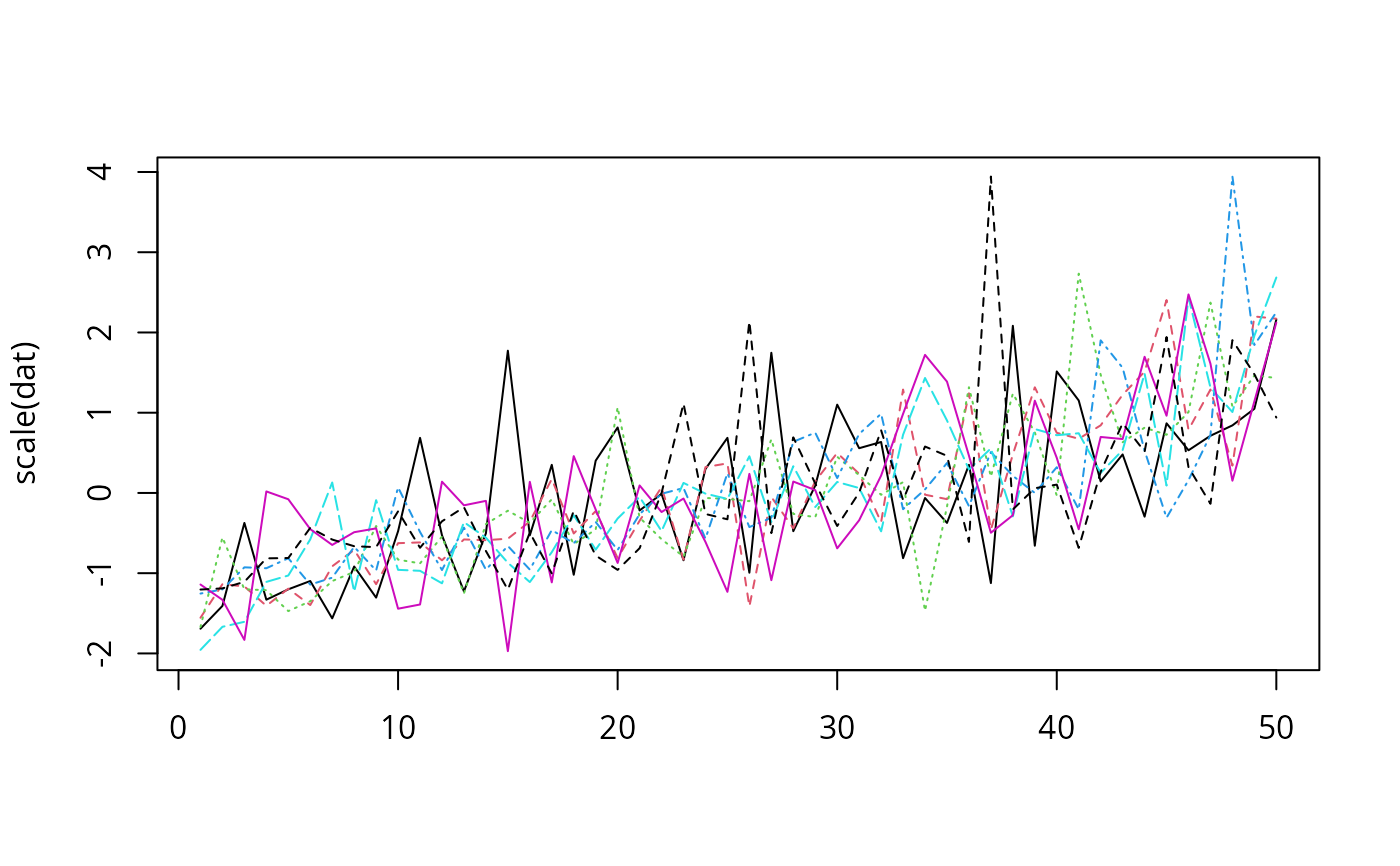
matplot(scale(dat), type="l")


pc1 <- prcomp(dat, scale. = TRUE)
summary(pc1)
#> Importance of components:
#>                           PC1    PC2    PC3    PC4     PC5     PC6     PC7
#> Standard deviation     2.0285 1.1130 0.8519 0.5625 0.50791 0.47121 0.35222
#> Proportion of Variance 0.5878 0.1770 0.1037 0.0452 0.03685 0.03172 0.01772
#> Cumulative Proportion  0.5878 0.7648 0.8685 0.9137 0.95056 0.98228 1.00000
rec2 <- recover_pca_data(pc1, 2)

pairs(rec2)


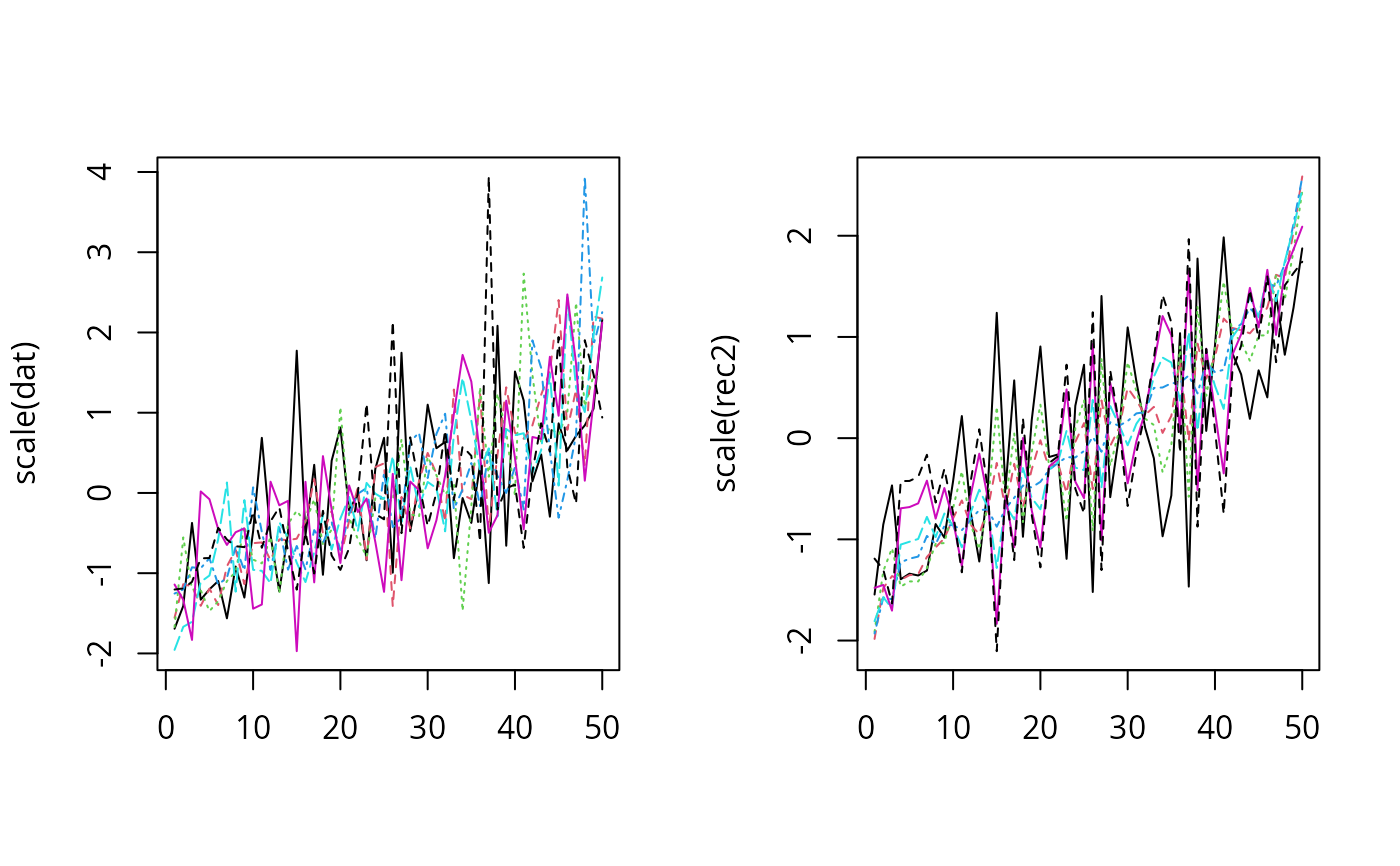
par(mfrow=c(1,2))
matplot(scale(dat), type="l")
matplot(scale(rec2), type="l")


j <- merge(dat, rec2, by=0)
pairs(j[,-1])
